ObjectBox EdgeX v1.1 – database with ARM32 support

ObjectBox EdgeX v1.1 – database with ARM32 support

With EdgeX Foundry just reaching v1.1, we continue to provide ObjectBox as an embedded high-performance database backend so you can start using ObjectBox EdgeX v1.1 right away. If you need data reliability and high-speed database operations, ObjectBox is for you. Additionally, starting with ObjectBox EdgeX 1.1, you can use it on 32-bit ARM devices.

Combining the speed and size advantages of ObjectBox on the EdgeX platform, we empower companies to analyze more data locally on the machine, enabling new use cases.

With ObjectBox-backed EdgeX we’re bringing the efficiency, performance and small footprint of the ObjectBox database to all EdgeX applications. It is fully compatible, so you can use it as a drop-in replacement: you call against the same REST and Go EdgeX APIs. As simple as that;no need to change any code.

Performance comparison of EdgeX database backends

EdgeX Foundry comes with a choice of two database engines: MongoDB and Redis. ObjectBox EdgeX brings an alternative to Redis and MongoDB to the table.  Because ObjectBox is an embedded database, optimized for high speed and ease of use while also delivering data reliability, it enables a new set of use cases. As we all know, benchmarks are hard to do. This is why all our benchmarks are open source and we invite you to check them out for yourself. To give you a quick impression of how you could benefit from using ObjectBox, let’s have a look at how each compares in basic database operations on “Device Readings”, one of the most performance intensive data points.

ObjectBox EdgeX
ObjectBox EdgeX

Note: The Read and Write operations (all CRUD (Create, Read, Update, Delete) operations are measured in objects / second). The benchmarks test internal EdgeX database layer performance, not the REST APIs throughput.

These benchmarks provide a good perspective why you should consider ObjectBox with EdgeX. Benchmark sources are available publicly in ObjectBox EdgeX github repo.

So, why is ObjectBox EdgeX faster?

First of all, you are probably aware of the phrase “Lies, damned lies, and statistics benchmarks”. Of course, you should look at performance for yourself and consider based on your specific use case needs. That’s why we make our benchmarks available as open source. It is a good starting point.

To make it easier to compare ObjectBox (in addition to our open source benchmarks) here are some of the high-level “unfair advantages” that make ObjectBox fast:

  • Objects: As you can derive from its name, ObjectBox is all about for objects. It’s highly optimized for persisting objects. The EdgeX architecture and Go sources are a great fit here as it puts Go’s objects (structs) in the center of its interface. This means, we can omit costly transformations and this helps with speed.
  • Embedded database: Redis and MongoDB are client/server databases running in separate processes. ObjectBox, however, is running in the same process as EdgeX itself (each EdgeX microservice, to be precise). This has definite efficiency advantages, but it also comes with some restrictions: Whereas you can put Redis/MongoDB in separate Dockers or machines, this option is not available for ObjectBox yet.
  • Transaction merging: ObjectBox can execute individual write operations in a common database transaction. This means, we can reduce the costly transactions for a number of write operations. This is a great way to add on performance, delaying the transaction end by single digit milliseconds.

Get started with ObjectBox EdgeX

The simplest way to get started is to fetch the latest docker-compose.yml and start the containers:

You can check the status of your running services by going to http://localhost:8500/. At this point, you have the REST services running at their respective ports, available to access from your EdgeX applications.

Find more details, instructions for ARM32, and sources in our GitHub repo at  https://github.com/objectbox/edgex-objectbox.

If you’re new to EdgeX, find out all about the open source  IoT Edge Platform here. The EdgeX project is led by the Linux Foundation and supported by many industry players, including Dell, IBM, and Fujitsu.

We love to hear from you ?

We’re very interested to hear about the challenges you are facing on the edge and in IoT. As performance experts, we are always embracing a tough challenge. Reach out to us to set up a pilot project.

Is there something you are missing? Please do reach out to us. We want to make ObjectBox the best edge data persistence layer available. We love to receive your feedback.

What next?

Find out more about ObjectBox EdgeX and get started, go directly to GitHub or download the snap on Snapcraft.

How to benchmark database performance – and ObjectBox

How to benchmark database performance – and ObjectBox

Benchmarking the performance of databases is a science in and of itself and it’s hard to get reliable and comparable results. Therefore, we decided to note down some standard patterns and pitfalls when doing database benchmarks we learned about over the years. We are including specific notes and things to consider when benchmarking ObjectBox.

Database Benchmarking Tips

Designing a benchmarking test

Phrase your research question

When you want to benchmark databases, you will usually have a specific use case in mind and want to answer questions regarding that case. Therefore, before writing your first line of code, have a look at what it is you want to benchmark, why, and what statement you want to be able to make at the end. Just writing down a simple question like “Is X faster than Y doing A?” can help you verify that the finished benchmark actually measures what you want it to.

Start documenting

Whatever you do, document each step diligently. Benchmarks that are not properly documented are challenging to reproduce, and thus of limited worth. So, the mantra in benchmarking really is: Document, document, document. That way it is also easier to go back later and make adjustments if needed. 

Select the sample

If you have a clear use case and goal in mind, this probably determines the type of databases you are going to consider for your benchmark. Generally speaking, benchmarks should compare databases of similar type and not mix approaches that are too different. A database might be designed to run on a cluster of servers and not, like ObjectBox, on a constrained device (e.g. a smartphone, Raspberry Pi or IoT device). Or data may be stored as documents (e.g. NoSQL) and not in a relational table-like structure (e.g. SQL); or on disk and not in-memory. Consistency guarantees can also make a difference (ACID-compliance vs. not transactionally safe). Document why you chose these databases for comparison. 

Become an expert

Once you have decided on what databases and features to compare, familiarize yourself with the APIs of the products, e.g. by reading the documentation or looking at code examples. Making wrong assumptions about how a feature works can skew your results and make a product appear much faster or slower than it actually is. If the code is open source, it can also help to dive into the code to see how things actually work. For example: an insert function runs asynchronously so the function call returns immediately, but the actual insert still executes in the background. To correctly measure the actual time it takes to complete the insert, you need to do some additional work.

Things to watch out for when coding benchmarks

database benchmark

Let’s move on to some specific coding tips. A benchmark is only as good as its time measurement. Check what APIs your test platform offers to get the time; they might be affected by how and from which thread they are called. Make sure, you find an accurate way to measure the time that does not skew up your results. For example, on Android there are numerous possibilities beyond using currentTimeMillis(). 

If a measured code block executes so fast it is near the available precision of your clock (e.g. time is in milliseconds, but code takes microseconds), consider running it multiple times and measure the total time of all runs. 

Next, before starting each measurement, make sure to free up memory and clear references no longer in use by the previous measurement or setup code. If the environment your benchmark is written for uses a garbage collector, check if it can be triggered manually to free memory (e.g. System.gc() in Java). Otherwise each consecutive measurement might be skewed due to less and less memory being available or a garbage collector halting execution to free memory. In your benchmarking results, you should look out for strange results like a continual decrease in performance from run to run.

Furthermore, take into account that some runtime environments, for example the Java Virtual Machine, do just-in-time compilation. This can cause a delay the first time code is executed, but provide better performance on subsequent executions. The effect of this on the final result can however be minimized by proper testing procedure, e.g. by running a code block multiple times instead of once and measuring the total execution time.

Then something obvious, but easily overlooked, is to ensure that between the start and end of a measurement only the functionality that you actually want to compare is executed. So avoid or turn off logging (a seemingly innocent string concatenation can skew results) and construct test data outside of a measured code block.

To be absolutely sure that your code is doing what you intended it to, use a profiler to inspect resource usage during a trial run. IDEs like Android Studio and Xcode come with an embedded profiler, and there are also several standalone profilers to choose from.

Optimizing benchmarks for meaningful results – with ObjectBox examples

Before benchmarking the chosen databases, make sure you understand their differences and default settings to adjust all settings to be comparable. In the following section, we will go through the most important differences and settings you need to look out for based on ObjectBox as an example.

Transactions, Durability, Consistency, ACID – how to make your benchmarks comparable

First, be aware of the impact the use of transactions or lack thereof can have. For databases, committing a transaction is an expensive operation as it requires waiting until the disk has safely stored the data. If possible, group multiple operations into a single transaction. For example, in the ObjectBox code snippet below, there is a notable speed-up when wrapping multiple box operations into a transaction block.

Speaking of transactions, also check if using bulk operations is possible. These also use transactions to speed up execution. E.g. instead of performing a put on each entity in a list, put the whole list.

The ObjectBox transactions docs provide more details and are available for Java, Swift or Go – though the basic principle is the same across languages. 

Second, and closely related to transactions, are durability guarantees when writing data. This is about the “D” in the popular ACID acronym (Atomic, Consistent, Isolated and Durable). ObjectBox transactions and standard (non-async) operations are fully ACID-compliant.

Thus, pay close attention to what durability modes other tested databases guarantee, or respectively, which durability mode you want to measure. Most NoSQL databases don’t give hard durability guarantees. Some provide an extra command or special mode to enforce durability. Therefore, if your use case needs to ensure data is actually stored safely after a write operation, you would need to enable this durability for other databases when comparing to ObjectBox.

On the other hand, if you are interested in scenarios that emphasize performance over durability, you should look into the OjectBox async APIs. Those don’t come with durability guarantees unless you define “checkpoints” in your code to wait for async operations.

Indexing – how to make your database queries efficient

Third, when measuring query operations, see if you can use indexes, another typical database optimization. If the database has an index on a property that is used in a query condition, it can find matches much faster. 

An index makes queries “scalable” – the more objects are stored, the more an index makes sense. Without an index, a database has to do a “full scan” over all potential results. 

Number of objects and the disk bottleneck – how to measure the database and not the disk

And lastly, keep an eye on the number of objects you operate on. For example, if you put a single object, something like 99.99% percent will be spent on disk I/O. Thus, if you test this on several databases, the chance of getting about the same results on all databases is quite high. The limiting factor is always the disk. So if you want to measure the efficiency of converting objects into their persisted counterparts instead, you should look at much higher object counts to factor the disk out of the equation. Depending on the disk and device speed, a bulk “put” of 10K, 100K or 1 million objects will make more sense to measure in this context.

Multi threaded tests – how to set writers and readers

ObjectBox is build upon a multiversion concurrency control foundation, and thus is ready for multi threaded access. Each thread will have a consistent transactional view of the data. ObjectBox differentiates between “readers” (a thread currently in a read transaction) and “writers” (a thread currently in a write transaction). Readers never block; no matter what goes on in other threads. However, a writer will block other writers when using standard transactions. Writers are sequential; only a single writer can be run at any time. Thus, if your load is write-heavy in multiple threads, you may want to look at the asynchronous APIs of ObjectBox. These handle write operations very efficiently; no matter how many threads are involved.

Extending the database size limit – size matters

By default, ObjectBox limits the database size to 1 GB to avoid filling up the disk by accident (e.g. your code has a bug in a data insertion loop). So if you use large data sets to benchmark, we recommended increasing the maximum database size when building the box store.

Preparing the benchmarks: devices and platforms

Once your benchmark code is ready, it’s time to set up the test device(s). The first step is to ensure other apps or processes are not doing (too much) work while your measurements run. Ideally, you would use a clean device with no apps installed or services configured. This is especially true for mobile devices: once you connect them and they start charging, the operating system might wake numerous apps to perform background work or network updates. You can somewhat avoid this by switching on airplane mode. And to be safe, wait a few seconds after connecting the device. 

Also ensure, this is again important for mobile devices, that your device does not enter a low power mode which reduces performance. For example on Android, keeping the screen on typically prevents that. When running on a laptop, check whether the power supply is plugged in and which power mode your operating system is set to. You may explicitly want to test in a certain power state or with the default behavior.

And just to mention it, make sure to turn off any profiling or monitoring tools that you used during building your benchmark. They can significantly skew your results.

When running on multiple devices, pay attention to the differences in hardware, like available memory and processor model, but also in software, like the operating system version. Different hardware and software might have different optimizations that can skew your results. Again, do not forget to document your device and software setup, so results can be properly interpreted and reproduced.

Running the database benchmark and collecting results

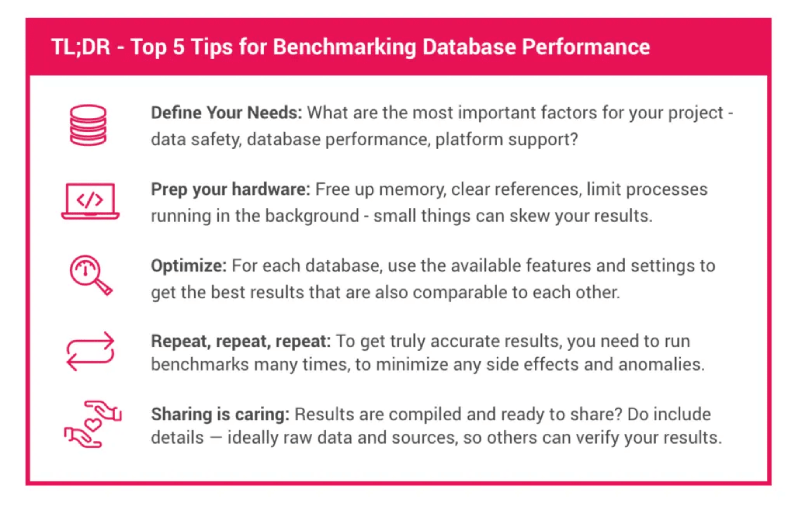
When it is time to run the benchmark it’s good to run it not once, not twice, but many times. This minimizes the impact of the various side effects we discussed above. Output the results of each run into a comma separated (CSV) or tabulator separated (TSV) format, that can easily be imported in a spreadsheet application for analysis. You can look at how the ObjectBox benchmark does it.

Once you have collected some data, verify its quality. You might have already spotted outliers while perusing the results. Alternatively, calculate the average of all measurements and see if it deviates a lot from their median value. If you are familiar with it, look for a high variance value instead. Too many outliers or a high variance might hint at side effects of your benchmark code or device setup you have not considered. Better double check to be sure.

Also coming soon ObjectBox time series which will provide users an intuitive dashboard to see patterns behind the data. It will further help users to track thousands of data points/second in real-time.

How to publish meaningful database performance benchmarks

The final step is to share your results with the world (or just your team). Make sure it’s clear what exactly you have measured and how you have arrived at those results. So include which device and software was used, how they were configured, what you did before running the benchmark and how the benchmark was run.

If possible, share the generated raw data so others can verify that your calculations, and remember to lead to the published results. Even better, publish the source code as well, so others can run it on other devices or help you spot and fix issues.

Last not least: Be careful to draw conclusions. Rather let the data speak for itself. Respond to questions and feedback. Be honest, if you learn your benchmarks may be skewed and update them. In the end, everyone wins by getting more meaningful results.

Your content goes here. Edit or remove this text inline or in the module Content settings. You can also style every aspect of this content in the module Design settings and even apply custom CSS to this text in the module Advanced settings.

App Bundle and Sideloading: how to prevent crashes

App Bundle and Sideloading: how to prevent crashes

Sideloading can cause crashes when used with Android App Bundle. Google is pushing Android developers to publish their apps to Google Play using the new Android App Bundle format. While it comes with benefits, it can also cause your app to crash, if users sideload your app. We’ll explore why this happens and how to fix it.

Android App Bundle (AAB) enables smaller app downloads and updates, increasing the chances that more people will install your app. Developers benefit as well by only having to build a single artifact instead of multiple APKs tailored to various types of devices.

App Bundle and Sideloading

The Play Store will take care of installing the right set of split APKs from the App Bundle for each user’s device configuration. But what happens, if users bypass Google Play and sideload the app? Sideloading has been popular (APKMirror anyone?) to get early access to new versions of an app or to not waste expensive data volume on app downloads (relevant e.g. in various parts of Africa and India).

To explain how sideloading can break your app, let’s first have a look at what Google Play would actually install onto a device when you publish an App Bundle. For this we use bundletool, which Android Studio and Google Play also use, to convert an App Bundle to a set of APKs for a specific device. We’ll build an App Bundle for our ObjectBox Kotlin example app and start an emulator running Android Pie (you can connect a real device as well). Then we can run the command:

If we extract the created connected.apks file (e.g. using unzip or 7-Zip) we find three split APKs. A master APK containing the app’s manifest and all of its code. An x86 APK containing the ObjectBox native library. And a xxhdpi APK with some resources specific for the screen density of the emulator device. Depending on your app (if it uses dynamic feature modules or includes translations) and connected device there might be more or less split APKs. But let’s stick with these three.

how to prevent crashes

Out of the three only the master APK can be installed on its own. The others will fail to install. You can try this yourself by dropping the APKs onto an emulator.

Crashing with LinkageError

Now how does this affect sideloading? You can probably already see the issue: due to lack of awareness that you are using the cool new App Bundle format, users only share the master APK. And as mentioned it installs just fine. However, at runtime your app might access a native library like ObjectBox or some density-specific resources. As these are not part of the master APK your app will crash. Bummer.

Detecting and fixing broken installations

But fret not! To make sure your users can enjoy a working app Google provides the Play Core library that can detect incorrect installs (since version 1.6.0). Simply add the dependency:

And add a check in your Application class:

If you do not have an Application class or are using content providers check the full documentation. To see this as part of a working app look at the ObjectBox Kotlin example.

Et voilà, instead of your app crashing users will see a dialog asking them to reinstall the app from the Google Play Store (or “an official store” if the library can’t detect it).

App Bundle, how to prevent crashes

How it works

So how does Play Core know if parts of your app are missing? The library is obfuscated – as most Play libraries are. However, decompiling (just open the class files in Android Studio) allows some basic analysis.

At first, it verifies that the device is API level 21 or higher. Older versions of Android do not support split APKs, so no need to check on these devices.

Then it makes sure that the currently installed version of your app actually requires APK splits. After all, you might still distribute your app as a full blown APK to some devices. This check just looks for a special meta-data manifest tag. This tag is added by bundletool (read Play Store) when converting an App Bundle to a set of split APKs (drop the master APK onto Android Studio and check AndroidManifest.xml).

Now that it is certain your app requires multiple APKs for installation it asks PackageManager for the PackageInfo of your app. Starting with API level 21 this has a splitNames property which has the names of any installed split APKs for your app package. If it is empty one or more APKs were not installed and the user is warned to reinstall the app. Straightforward.

Curiously it also warns you, if there is only one entry with an empty name. Please let us know in the comments why you think that is.

And that is it. Make sure to add the Play Core detection if your app is using ObjectBox and App Bundle to avoid sideloading crashes and keep your users happy.

ObjectBox 1.3 improves developer tooling

In ObjectBox 1.3 we made some changes under the hood to give developers a more powerful tooling. We recommend everybody to update. We’ve worked closely with developers of a complex app with millions of active users. At that scale, how can ObjectBox best support the development process? The 1.3.x releases (1.3.0 – 1.3.4) address this with extended debug logging, JSON data downloads, and many small but helpful improvements and fixes. This would not have been possible without your continued feedback. Thank you!

(more…)